Monday, August 29, 2011

Analysis Services Default Member Through Stored Procedure

Today, I had to dynamically assign default member value to an analysis services dimension. Scenario: Each user (AD login) has a preferred or default value assigned on time basis. So depending on which date data is sliced it always comes up with the value default of the current user.
For this we would need to create a mapping table in Relational database with date, user and default value.
Create a basic User Stored Procedure (uspGetUserDefaultValue) which takes username (AD Login) as a parameter, selects on the mapping table based on username passed and returns a single value.
Now we create a solution in Visual Studio 2008. This can be of class project template. We would be creating a custom DLL and register with SQL Server Analysis Services solution. Where SSAS solution would use function calls exposed by custom DLL. I created the project as part of my SSAS solution for better manageability.
We would need to add:
Microsoft.AnalysisServices
Microsoft.AnalysisServices.AdomdClient
as reference to our custom dll project. These can be of version 10 (SQL 2008) or version 9 (SQL 2005). Works fine with either, seamlessly interchangeable.
Now we create/rename our namespace and class to like
Project/Assembly: AnalysisServicesCustomLibrary
Namespace: CustomMethodCollection
Class: CustomMethods
or whatever you like.
Create a public static function like:
public static string GetUserDefaultValue(string userName)
{
OleDbConnection connection;
        try
        {
         connectionString ="provider=sqloledb;server=;database=;trusted_connection=yes";
           connection= new OleDbConnection(connectionString);
           connection.Open();
           OleDbCommand command= new OleDbCommand("uspGetUserDefaultValue", connection);
               command.CommandTimeout = 0;
               command.CommandType = CommandType.StoredProcedure;
               command.Parameters.Add(new OleDbParameter("@UserLogin", OleDbType.VarChar, 50));
               command.Parameters[0].Value = userName;
               
               DataTable dataTable = new DataTable("DefaultValue");
               OleDbDataAdapter dataAdapter= new OleDbDataAdapter(command);
               dataAdapter.Fill(dataTable);
               connection.Close();
               if (dataTable.Rows.Count == 0)
                   return "empty";
               string defaultValue = dataTable.Rows[0][0].ToString();
               return "[Dimension].[Dimension Attribute].&[" + defaultValue + "]";
           }
           catch (Exception ex)
           {
               errorMessage = "Some error: " + ex.Source + " Message: " + ex.Message;
               throw new Exception(errorMessage, ex);
           }
       }
The return part is critical since here we would be formatting the return value into a MemberUniqueName for the associated dimension attribute. Else is basic stuff, feel free to add better exception handling etc.

Do a quick test to see if you are getting the desired output from Stored Procedure and Class Function.
Now we move to Analysis Services solution. First step is to add reference to AnalysisServicesCustomLibrary project under Assemblies folder.
Next move to the dimension where you would like to have a default value. Go to properties of the attribute that would have the default value. Under DefaultMember enter:
STRTOMEMBER( AnalysisServicesCustomLibrary.CustomMethodCollection.CustomMethods.GetUserDefaultValue(UserName))
Here UserName is an Analysis Services keyword to get current logged in user’s account.
STRTOMEMBER converts the string passed by custom library’s function in a member.
Build/Deploy/Process cube. Run a query or browse the cube and you should have the default value against logged in user.


DEBUG
To debug your code, move to your custom library project. Go to Debug-->Attach to Process and select Msmdsrv.exe process. Add a breakpoint and try querying the dimension using the function.
References:

Friday, January 28, 2011

From Date To Date in PerformancePoint Analytical Chart


Today, we add From Date and To Date parameters to Performance Point Server Dashboard Designer’s Analytical Reports. Many times this is a requirement to allow users to select a starting and ending date to view charts/reports. This gives dynamic behavior to time range as compared to using pre-defined date attributes like Month, Week etc.

Start with creating a Report and select Analytical Chart. Add your required Dimensions and Measures including Time dimension.

Once done, move to the Query tab of the report it should be something like below depending on what artifacts you drop :

For demo I am using Time dimension on Bottom Axis and Total Time Decimal on Series. You are free to move time to any other axis. No worries, same process would apply.
From the bottom of the page add parameter from the Parameters section. Name them what you like, for purpose I use FromDate and ToDate. Give default values, these can be any valid dates.

With every parameter you add you would find a value added to your query canvas like <> and <>. For now it does not matter where they are just add parameters.
Move to your query and where ever your time dimension is used replace that with:
HIERARCHIZE ( {<>:<>} )
Your final query would be like:

Save/Publish your report.
In your dashboard section add filters from Filters tab. I am using Time Intelligence Calendar filters but any type of filter can be used.

If you opt to use any other type of filter remember to set your values in Report query respectively.
Now we have our filters and report. We add them to the dashboard page like so:

Now we start linking filters and report. First link FromDate filter like so:

In source value select your data source, here TestFromTo is my data source. Next press Filter Link Formula and type in Day. This defines what level of a hierarchy we would be referencing. Remember to setup Time properties in your data source.
Similarly we link ToDate filter like:

All done. Save/Publish and Preview.

Here dates selected in 14th September, 2009 and the report displays data for that day. Now changing the ToDate to 18th September, 2009 would show:

And we have From Date and To Date filters working on an Analytical Report.
This is very intuitive way of showing data to end users. A lot of stakeholders ask for this feature especially for Trend Charts/Reports.
Downside to this implementation is that we lose the right click contextual features of analytics like drill downs, decomposition tree etc.

Wednesday, October 6, 2010

MDX Date dimension in Descending Order

Scenario:
The client is refusing to make the change to the filters to allow more than 500 entries due to concern that the performance will be degraded for all of their performancepoint dashboards.  Would it be possible to change the date filters so that the most recent dates appear first in the list?  This would cause the older items to be truncated rather than the most recent.

select
[Measures].[Some Units] on 0,
ORDER ( 
nonempty(
[time].[year-quarter-month-week-date].members,[Measures].[Some Units])
,[time].[year-quarter-month-week-date].CurrentMember.MemberValue , desc) on 1
from [MyCube]

This would retain the hierarchies and sort the date filters with most recent date first. So that the past values would be automatically filtered out (more than 500 ones).

No need to change the web.config!

The date dimension is SSAS business intelligence time dimension (auto generated).  

Reference:

Changing the limit on the number of items returned in a filter

Thursday, May 20, 2010

Pass Parameter to Analytical Report PPS 2010

Questions: Can we pass a parameter value to an analytical report in our new SharePoint 2010's PerformancePoint Services environment? For example passing a numeric factor to report and calculate a new measure based on user input.
Answer: Yes. I would assume that you have already a working environment of SharePoint 2010 along with PerformancePoint Services. We begin by opening the PerformancePoint Dashboard Designer.

Right click 'Data Connections' or from 'Create' ribbon select 'Data Source'. Configure to your already deployed cube.


Right click on 'PerformancePoint Content' select 'New -> Report' or from 'Create' ribbon select 'Other Reports'. From the dialog box select 'Analytical Chart'. Press OK.

Name your report as desired I name it 'Factorize Me'.
  

For the sake of simplicity I would add one time dimension to the bottom axis and numeric value to series. This numeric values is upon which we are going to apply the factor. In my case it is 'Sales Amount'.

I am using a Banking analysis services cube provided by Microsoft but this method can be used for any measure.
One more thing I would like to mention is regarding the use of sales amount as this tutorial would allow user to apply factor on sales for what ifs. Like what if I increase sales by 10% we can enter 1.1 and we have a projected sale of 10%. One can see a good utilization of this.

Back to the designing. Once we added the our dimensions we move to the 'Query' part of the report since we need to add a parameter.
Here is the query created by PerformancePoint Services:
SELECT
HIERARCHIZE( { [Tr Date].[YearToMonth].[Calendar Year].&[2009].&[Q 1].&[March], [Tr Date].[YearToMonth].[Calendar Year].&[2009].&[Q 2].&[April], [Tr Date].[YearToMonth].[Calendar Year].&[2009].&[Q 2].&[May] } )
ON COLUMNS,

{ [Measures].[Sales Amount]}
ON ROWS

FROM [Bank DW]

We would be editing it and adding a parameter. First add the required measure something like 'Target'.
WITH MEMBER [Measures].[Target] as ([Measures].[Sales Amount] * <> )
here <> is our parameter and would be automatically added to parameters section below. One thing to note is that I am using measure sales amount to make the change visible but we can use any other measure here.
Finally we use this new Target measure on ROWS along with sales amount measure. Here is the final query:
WITH MEMBER [Measures].[Target] as ([Measures].[Sales Amount] * <> )

SELECT
HIERARCHIZE( { [Tr Date].[YearToMonth].[Calendar Year].&[2009].&[Q 1].&[March], [Tr Date].[YearToMonth].[Calendar Year].&[2009].&[Q 2].&[April], [Tr Date].[YearToMonth].[Calendar Year].&[2009].&[Q 2].&[May] } )
ON COLUMNS,

{ [Measures].[Sales Amount], [Measures].[Target] }
ON ROWS

FROM [Bank DW]

Assign a default value to our parameter <> and switch to design pane where you would be seeing 2 measures now (Sales Amount and Target).


Next create dashboard add the report. Right click the dashboard and select 'Deploy to SharePoint...'. 

Wait for the SharePoint page to load and you can see the report.
 
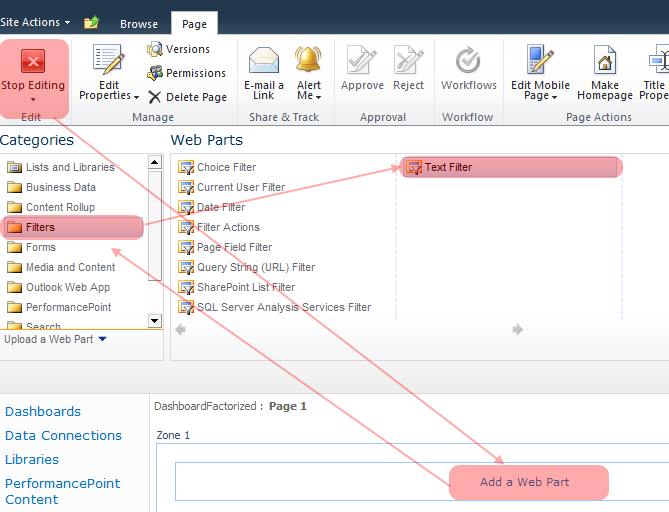
Time to add an input field where use can enter a value to be used by our report. So select 'Edit Page' from top. Click on 'Add Web Part' on which ever zone you would like the input box to appear. This would open the web part gallery. From 'Categories' select 'Filters' and from there select 'Text Filter'. Press 'Add' button.

 
Rename web part to your liking.

From web part setting select 'Connections' >> 'Send Filter Values To' >> 'Factorize Me' (this is the name of our analytical report). On the configure connection dialog box just check if the correct parameter is selected and press 'Finish'.


That is it, we are done. Enter a value and see the Target value change. (if the values does not change try edit/save SharePoint page again)
Cool feature to SharePoint 2010 to be able to connect web parts to PerformancePoint content.

One downside to this is that when we use custom MDX in reports the inherent analytic features are disabled like drill downs, pivot, (the new very useful) adding measure on the go etc.
External Links:
MDX in Dashboards, Scorecards, and Views?

Wednesday, May 12, 2010

SharePoint 2010 location of log files

If anyone is wondering what is the location of SharePoint 2010 log files. Copy the line below and paste it in run:
%programfiles%\Common Files\Microsoft Shared\Web Server Extensions\14\LOGS

SharePoint 2007 had '12' folder and SharePoint 2010 has '14'... hmm where did '13' go??? Superstitious I presume since most building don't have 13th floors :D

Monday, May 3, 2010

PerformancePoint and Default Fitler Values

Default behavior of PerformancePoint filters is to persist the values selected before, so that when dashboard reopens the filter values are set to those used previously. But what if we need to change that THEN the following article is what is needed:

http://blogs.msdn.com/performancepoint/archive/2008/02/12/always-display-default-filter-selection-in-dashboards.aspx

(Image taken for the above article)

Monday, April 26, 2010

XSL Conditional Format based on QueryString using SharePoint Designer

Today I had to add a success message on ContactUs page built on MOSS website using SharePoint Designer.
I had already built a ContactUs form, built by using DataFormWebPart A.K.A DataViewWebPart, where a user can enter some information and submit using only out of the box components using SharePoint Designer (which I will cover in this blog sometimes later).
Problem was, information was submitted successfully but no message was displayed to end user. So following is how I accomplished it.

First add a parameter in 'Common Data View Tasks' as shown in the screen shot.
Press 'New Parameter' and select 'Parameter Source' as Query String, assign a name like in this case 's' and a default value.

This would declare a xsl parameter in our DataView web part like:
<xsl:param name="Success">0</xsl:param>

Next is to redirect the same page with a querystring value which would indicate success.For that 'Submit' button is changed to send querystring "?s=1" on submit.
To do that:
Right click 'Submit' button, choose 'Form Actions...'. In 'Navigate to page' append the querystring.
Press Ok.

Finally in the XSL we use this value of query string Success as:
If page submitted using the Submit button
<xsl:if test="$Success = 1" >
  <table>
    <tr>
      <td>Thank you for your request</td>
    </tr>
  </table>
</xsl:if>

Else any other value we show the table containing the contact us form.
<xsl:if test="$Success != 1" >
  <table border="0" width="80%">
    <xsl:call-template name="dvt_1.body">
      <xsl:with-param name="Rows" select="$Rows"/>
    </xsl:call-template>
  </table>
</xsl:if>


Other possibilities can be to show an Alert which can be done by using the following code in side the conditional xsl:
<xsl:text disable-output-escaping="yes">
<!--[CDATA[
<script>
  alert("Thank you")
</script>
]]--></xsl:text>

Good Day to all.
External Links: 
Embed HTML in XML & Retrieve it with XSL