Today, we add From Date and To Date parameters to Performance Point Server Dashboard Designer’s Analytical Reports. Many times this is a requirement to allow users to select a starting and ending date to view charts/reports. This gives dynamic behavior to time range as compared to using pre-defined date attributes like Month, Week etc.
Start with creating a Report and select Analytical Chart. Add your required Dimensions and Measures including Time dimension.
Once done, move to the Query tab of the report it should be something like below depending on what artifacts you drop :
For demo I am using Time dimension on Bottom Axis and Total Time Decimal on Series. You are free to move time to any other axis. No worries, same process would apply.
From the bottom of the page add parameter from the Parameters section. Name them what you like, for purpose I use FromDate and ToDate. Give default values, these can be any valid dates.
With every parameter you add you would find a value added to your query canvas like <> and <>. For now it does not matter where they are just add parameters.
Move to your query and where ever your time dimension is used replace that with:
HIERARCHIZE ( {<>:<>} )
Your final query would be like:
Save/Publish your report.
In your dashboard section add filters from Filters tab. I am using Time Intelligence Calendar filters but any type of filter can be used.
If you opt to use any other type of filter remember to set your values in Report query respectively.
Now we have our filters and report. We add them to the dashboard page like so:
Now we start linking filters and report. First link FromDate filter like so:
In source value select your data source, here TestFromTo is my data source. Next press Filter Link Formula and type in Day. This defines what level of a hierarchy we would be referencing. Remember to setup Time properties in your data source.
Similarly we link ToDate filter like:
All done. Save/Publish and Preview.
Here dates selected in 14th September, 2009 and the report displays data for that day. Now changing the ToDate to 18th September, 2009 would show:
And we have From Date and To Date filters working on an Analytical Report.
 This is very intuitive way of showing data to end users. A lot of stakeholders ask for this feature especially for Trend Charts/Reports.
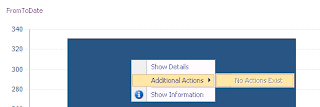
Downside to this implementation is that we lose the right click contextual features of analytics like drill downs, decomposition tree etc.


If I add a parameter to the report then my existing connection breaks from the other filter
ReplyDeleteThe Connect To dropdown only shows the Parameter I created
Is this expected ?
Is yes what should I do to resolve it?
Once you make any change in Query tab you can only make connection to the parameters you define there. Any yes all existing connections reset.
ReplyDeleteBest would be to decide which parameters you need before connecting.