Wednesday, October 6, 2010

MDX Date dimension in Descending Order

Scenario:
The client is refusing to make the change to the filters to allow more than 500 entries due to concern that the performance will be degraded for all of their performancepoint dashboards.  Would it be possible to change the date filters so that the most recent dates appear first in the list?  This would cause the older items to be truncated rather than the most recent.

select
[Measures].[Some Units] on 0,
ORDER ( 
nonempty(
[time].[year-quarter-month-week-date].members,[Measures].[Some Units])
,[time].[year-quarter-month-week-date].CurrentMember.MemberValue , desc) on 1
from [MyCube]

This would retain the hierarchies and sort the date filters with most recent date first. So that the past values would be automatically filtered out (more than 500 ones).

No need to change the web.config!

The date dimension is SSAS business intelligence time dimension (auto generated).  

Reference:

Changing the limit on the number of items returned in a filter

Thursday, May 20, 2010

Pass Parameter to Analytical Report PPS 2010

Questions: Can we pass a parameter value to an analytical report in our new SharePoint 2010's PerformancePoint Services environment? For example passing a numeric factor to report and calculate a new measure based on user input.
Answer: Yes. I would assume that you have already a working environment of SharePoint 2010 along with PerformancePoint Services. We begin by opening the PerformancePoint Dashboard Designer.

Right click 'Data Connections' or from 'Create' ribbon select 'Data Source'. Configure to your already deployed cube.


Right click on 'PerformancePoint Content' select 'New -> Report' or from 'Create' ribbon select 'Other Reports'. From the dialog box select 'Analytical Chart'. Press OK.

Name your report as desired I name it 'Factorize Me'.
  

For the sake of simplicity I would add one time dimension to the bottom axis and numeric value to series. This numeric values is upon which we are going to apply the factor. In my case it is 'Sales Amount'.

I am using a Banking analysis services cube provided by Microsoft but this method can be used for any measure.
One more thing I would like to mention is regarding the use of sales amount as this tutorial would allow user to apply factor on sales for what ifs. Like what if I increase sales by 10% we can enter 1.1 and we have a projected sale of 10%. One can see a good utilization of this.

Back to the designing. Once we added the our dimensions we move to the 'Query' part of the report since we need to add a parameter.
Here is the query created by PerformancePoint Services:
SELECT
HIERARCHIZE( { [Tr Date].[YearToMonth].[Calendar Year].&[2009].&[Q 1].&[March], [Tr Date].[YearToMonth].[Calendar Year].&[2009].&[Q 2].&[April], [Tr Date].[YearToMonth].[Calendar Year].&[2009].&[Q 2].&[May] } )
ON COLUMNS,

{ [Measures].[Sales Amount]}
ON ROWS

FROM [Bank DW]

We would be editing it and adding a parameter. First add the required measure something like 'Target'.
WITH MEMBER [Measures].[Target] as ([Measures].[Sales Amount] * <> )
here <> is our parameter and would be automatically added to parameters section below. One thing to note is that I am using measure sales amount to make the change visible but we can use any other measure here.
Finally we use this new Target measure on ROWS along with sales amount measure. Here is the final query:
WITH MEMBER [Measures].[Target] as ([Measures].[Sales Amount] * <> )

SELECT
HIERARCHIZE( { [Tr Date].[YearToMonth].[Calendar Year].&[2009].&[Q 1].&[March], [Tr Date].[YearToMonth].[Calendar Year].&[2009].&[Q 2].&[April], [Tr Date].[YearToMonth].[Calendar Year].&[2009].&[Q 2].&[May] } )
ON COLUMNS,

{ [Measures].[Sales Amount], [Measures].[Target] }
ON ROWS

FROM [Bank DW]

Assign a default value to our parameter <> and switch to design pane where you would be seeing 2 measures now (Sales Amount and Target).


Next create dashboard add the report. Right click the dashboard and select 'Deploy to SharePoint...'. 

Wait for the SharePoint page to load and you can see the report.
 
Time to add an input field where use can enter a value to be used by our report. So select 'Edit Page' from top. Click on 'Add Web Part' on which ever zone you would like the input box to appear. This would open the web part gallery. From 'Categories' select 'Filters' and from there select 'Text Filter'. Press 'Add' button.

 
Rename web part to your liking.

From web part setting select 'Connections' >> 'Send Filter Values To' >> 'Factorize Me' (this is the name of our analytical report). On the configure connection dialog box just check if the correct parameter is selected and press 'Finish'.


That is it, we are done. Enter a value and see the Target value change. (if the values does not change try edit/save SharePoint page again)
Cool feature to SharePoint 2010 to be able to connect web parts to PerformancePoint content.

One downside to this is that when we use custom MDX in reports the inherent analytic features are disabled like drill downs, pivot, (the new very useful) adding measure on the go etc.
External Links:
MDX in Dashboards, Scorecards, and Views?

Wednesday, May 12, 2010

SharePoint 2010 location of log files

If anyone is wondering what is the location of SharePoint 2010 log files. Copy the line below and paste it in run:
%programfiles%\Common Files\Microsoft Shared\Web Server Extensions\14\LOGS

SharePoint 2007 had '12' folder and SharePoint 2010 has '14'... hmm where did '13' go??? Superstitious I presume since most building don't have 13th floors :D

Monday, May 3, 2010

PerformancePoint and Default Fitler Values

Default behavior of PerformancePoint filters is to persist the values selected before, so that when dashboard reopens the filter values are set to those used previously. But what if we need to change that THEN the following article is what is needed:

http://blogs.msdn.com/performancepoint/archive/2008/02/12/always-display-default-filter-selection-in-dashboards.aspx

(Image taken for the above article)

Monday, April 26, 2010

XSL Conditional Format based on QueryString using SharePoint Designer

Today I had to add a success message on ContactUs page built on MOSS website using SharePoint Designer.
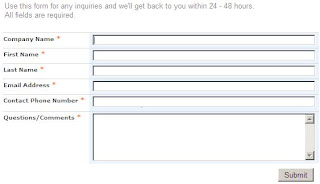
I had already built a ContactUs form, built by using DataFormWebPart A.K.A DataViewWebPart, where a user can enter some information and submit using only out of the box components using SharePoint Designer (which I will cover in this blog sometimes later).
Problem was, information was submitted successfully but no message was displayed to end user. So following is how I accomplished it.

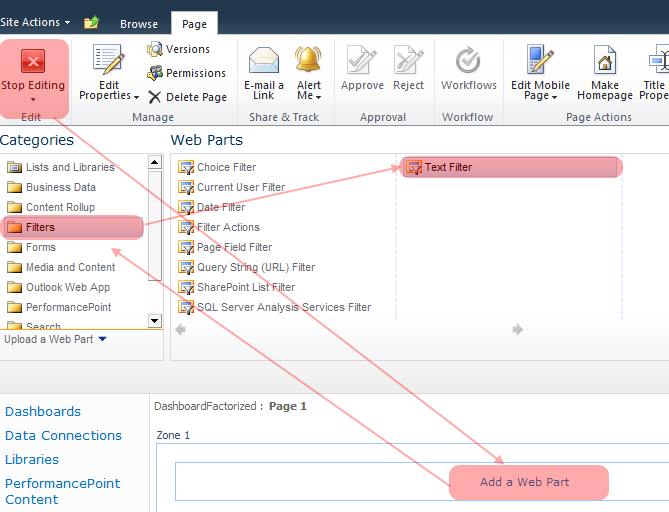
First add a parameter in 'Common Data View Tasks' as shown in the screen shot.
Press 'New Parameter' and select 'Parameter Source' as Query String, assign a name like in this case 's' and a default value.

This would declare a xsl parameter in our DataView web part like:
<xsl:param name="Success">0</xsl:param>

Next is to redirect the same page with a querystring value which would indicate success.For that 'Submit' button is changed to send querystring "?s=1" on submit.
To do that:
Right click 'Submit' button, choose 'Form Actions...'. In 'Navigate to page' append the querystring.
Press Ok.

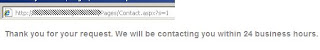
Finally in the XSL we use this value of query string Success as:
If page submitted using the Submit button
<xsl:if test="$Success = 1" >
  <table>
    <tr>
      <td>Thank you for your request</td>
    </tr>
  </table>
</xsl:if>

Else any other value we show the table containing the contact us form.
<xsl:if test="$Success != 1" >
  <table border="0" width="80%">
    <xsl:call-template name="dvt_1.body">
      <xsl:with-param name="Rows" select="$Rows"/>
    </xsl:call-template>
  </table>
</xsl:if>


Other possibilities can be to show an Alert which can be done by using the following code in side the conditional xsl:
<xsl:text disable-output-escaping="yes">
<!--[CDATA[
<script>
  alert("Thank you")
</script>
]]--></xsl:text>

Good Day to all.
External Links: 
Embed HTML in XML & Retrieve it with XSL

Wednesday, March 31, 2010

KPI Threshold Values From Table

Today i had a requirement to make Thresholds configurable in PerformancePoint's KPIs. In PerformancePoint we can make Target value to be stored in a separate table and use it. But in my case I was mostly working with percentages where target values is always 100% but the performance indicators are variable. As some >80% is green sometimes >70% is green.
Client needed to store these thresholds values in an independent table perhaps accomplishing 2 things:
  1. Access cube via excel and use these values
  2. Change in thresholds did not effect PPS KPIs.
As of yet I have not found a way to configure thresholds to be pulled from other source. There is an option in "Band by Stated score (advanced)" but it still uses a single value.

So following is the methodology to overcome this limitation:
  1. First I created 2 simple tables in my data mart. One table for source systems. Other for target values for Green and Yellow along with reference to source systems table.
  2. In my cube I used these 2 tables in an unrelated measure group. Source systems table being used as a dimension. Target value table used a fact table with a measure group.
These were all the backend changes required.
Now we move to PerformancePoint server's Dashboard Designer.

For each KPI in the Actual row use the following CASE expression:
CASE
when
[Measures].[My Value] >= ([Measure].[Green - Fact Target Values], [Dim Source].&[System XYZ])
Then 1
when
[Measures].[My Value] >= ([Measure].[Yellow - Fact Target Values], [Dim Source].&[System XYZ])
then 0
when
[Measures].[My Value] < ([Measure].[Yellow - Fact Target Values], [Dim Source].&[System XYZ])
then -1 END
WHERE
[Measure].[My Value] = Factual value upon which all measure are based.
[Measure].[Green - Fact Target Value] = Threshold value for Green indicator to be shown like 90 etc.
[Measure].[Yellow - Fact Target Value] = Threshold value for Green indicator to be shown like 80 etc.
([Measure].[Yellow - Fact Target Value], [Dim Source].&[System XYZ]) = Returns values for a particular system since I had multiple source systems.

In the Target value use [Measure].[My Value] in 'Data Mappings' and 'Source Data' in 'Calculations' to show values on dashboard.

For Thresholds use 'Increasing is Better' scoring pattern and 'Band by numeric value of Actual' banding method. Lastly for indicator values set 1 for Green, 0 for Yellow and -1 for Red.

That is all you need and no more adjusting Thresholds in Dashboard designer. Just modify values in the database table and you would be fine. Oh and yes you would be required to process your cube every time threshold values change.

Environment: SQL Server 2005, Performance Point Server 2007 SP2

Alternate Approach
Use SQL Server Analysis Services KPI do accomplish the same since it provides much simpler and easier way to use external goal values.

External Links:
  1. http://blogs.msdn.com/performancepoint/archive/2008/01/09/band-by-stated-score.aspx
  2. MS Press Microsoft SQL Server 2005 Analysis Services Step By Step Chapter 8 page 213

Thursday, February 11, 2010

Password Protected Access DB and SSIS

Today I shall show you how to import data using SSIS from MS Access 2007 which is password protected. Creating a connection using Access provider and now specifying password would give error:

To remove this error double click your new connection in the Connection Managers.

Move to the 'All' tab.


Enter the password against the propery "Jet OLEDB:Database Password".

And Test Connection. Success.