Showing posts with label SharePoint 2010. Show all posts

Wednesday, June 20, 2012

Content Organizer Rule Manager for SharePoint 2010


I am proud to release the beta version of Content Organizer Rule Manager (codename CORMa) for SharePoint 2010 today.

Background:
Working on a SharePoint 2010 enterprise project we had tons of content types on differest site. Creating and tracking content organizer rules from SharePoint interface was tedious going back and forth between pages. There is no option in SharePoint Designer to manager content organizer rules. Lastly there was a need to bulk create rules as some of our libraries had multiple content types associated.

CORMa to the rescue!
  • List and create content organizer rules in bulk.
  • Delete rules.
  • Works for all field types inlcuing Taxonomy fields.
  • Export all site content types with associated lists to text file.
  • Check inherent SharePoint rules for rule creation.
Download, test and give feedback...

Tuesday, June 19, 2012

XSL Link for SharePoint 2010 Web Parts

When using a lot of Links list in SharePoint 2010 the view can be quite 'boring'. To add some spice I have created an XSL style sheet and applied to List webpart through web part properties. Easy and fast:
  1. Get the XSL style sheet.
  2. Modify (if required)
  3. Upload to Style Library > XSL Style Sheets
  4. Edit web part and under Miscellaneous > XSL Link paste the path.
  5. Set Appearance > Chrome Type to 'Border Only'. Apply and save.
 Style classes are embedded in the XSL file which you may move on to your CSS files.
This would work on any list which is created on 'Link' list. I have added some logic to get list name (title) using XSL functions as it is pretty hard to do so. Let me know if someone knows an easier way, I can get the title in SharePoint Designer but on actual page it disappears. I think the View node is not available when XSL renders on page.
   
Again, this XSL is targeted towards Links list in SharePoint 2010 but can be extended/reused for other libraries as well. Just change [@Columns] as per your CAML.

<xsl:stylesheet version="1.0"
  xmlns:xsl=http://www.w3.org/1999/XSL/Transform
  xmlns:msxsl="urn:schemas-microsoft-com:xslt"
  exclude-result-prefixes="msxsl"
  xmlns:ddwrt2="urn:frontpage:internal">
<xsl:output method='html' indent='yes'/>

<xsl:template match='dsQueryResponse' xmlns:ddwrt="http://schemas.microsoft.com/WebParts/v2/DataView/runtime">

<style>
  .QLinksHeader{
            PADDING-BOTTOM: 2px; PADDING-LEFT: 2px; PADDING-RIGHT: 2px;
            DISPLAY: block; MARGIN-BOTTOM: 2px; BACKGROUND: #0d5995; COLOR: white;
            FONT-SIZE: 14px; PADDING-TOP: 2px }
  #QLinks {
            PADDING-BOTTOM: 0px; LIST-STYLE-TYPE: none; MARGIN: 0px;
            PADDING-LEFT: 0px; PADDING-RIGHT: 0px; PADDING-TOP: 0px; }
  #QLinks LI {
            BACKGROUND-IMAGE: url(/_layouts/images/icongo.gif); PADDING-LEFT: 2em;
            BACKGROUND-REPEAT: no-repeat; MARGIN-LEFT: 8px; FONT-SIZE: 12px;
            PADDING-BOTTOM: 5px }
  #QLinks LI a:hover{ text-decoration:underline; }
</style>

  <div cellpadding="10" cellspacing="0" border="1" >
    <SPAN class="QLinksHeader">
      <xsl:value-of select=" substring-before(substring-after(/dsQueryResponse/Rows/Row/@FileRef,'Lists/'),'/')" >
      </xsl:value-of>
    </SPAN>
    <ul id="QLinks">
      <xsl:apply-templates select='Rows/Row'/>
    </ul>
  </div>
</xsl:template> <xsl:template match='Row'>
  <li>
    <a href="{@URL}">
      <xsl:value-of select="@URL.desc" ></xsl:value-of>
    </a>
  </li>
</xsl:template>
</xsl:stylesheet>

Thursday, May 20, 2010

Pass Parameter to Analytical Report PPS 2010

Questions: Can we pass a parameter value to an analytical report in our new SharePoint 2010's PerformancePoint Services environment? For example passing a numeric factor to report and calculate a new measure based on user input.
Answer: Yes. I would assume that you have already a working environment of SharePoint 2010 along with PerformancePoint Services. We begin by opening the PerformancePoint Dashboard Designer.

Right click 'Data Connections' or from 'Create' ribbon select 'Data Source'. Configure to your already deployed cube.


Right click on 'PerformancePoint Content' select 'New -> Report' or from 'Create' ribbon select 'Other Reports'. From the dialog box select 'Analytical Chart'. Press OK.

Name your report as desired I name it 'Factorize Me'.
  

For the sake of simplicity I would add one time dimension to the bottom axis and numeric value to series. This numeric values is upon which we are going to apply the factor. In my case it is 'Sales Amount'.

I am using a Banking analysis services cube provided by Microsoft but this method can be used for any measure.
One more thing I would like to mention is regarding the use of sales amount as this tutorial would allow user to apply factor on sales for what ifs. Like what if I increase sales by 10% we can enter 1.1 and we have a projected sale of 10%. One can see a good utilization of this.

Back to the designing. Once we added the our dimensions we move to the 'Query' part of the report since we need to add a parameter.
Here is the query created by PerformancePoint Services:
SELECT
HIERARCHIZE( { [Tr Date].[YearToMonth].[Calendar Year].&[2009].&[Q 1].&[March], [Tr Date].[YearToMonth].[Calendar Year].&[2009].&[Q 2].&[April], [Tr Date].[YearToMonth].[Calendar Year].&[2009].&[Q 2].&[May] } )
ON COLUMNS,

{ [Measures].[Sales Amount]}
ON ROWS

FROM [Bank DW]

We would be editing it and adding a parameter. First add the required measure something like 'Target'.
WITH MEMBER [Measures].[Target] as ([Measures].[Sales Amount] * <> )
here <> is our parameter and would be automatically added to parameters section below. One thing to note is that I am using measure sales amount to make the change visible but we can use any other measure here.
Finally we use this new Target measure on ROWS along with sales amount measure. Here is the final query:
WITH MEMBER [Measures].[Target] as ([Measures].[Sales Amount] * <> )

SELECT
HIERARCHIZE( { [Tr Date].[YearToMonth].[Calendar Year].&[2009].&[Q 1].&[March], [Tr Date].[YearToMonth].[Calendar Year].&[2009].&[Q 2].&[April], [Tr Date].[YearToMonth].[Calendar Year].&[2009].&[Q 2].&[May] } )
ON COLUMNS,

{ [Measures].[Sales Amount], [Measures].[Target] }
ON ROWS

FROM [Bank DW]

Assign a default value to our parameter <> and switch to design pane where you would be seeing 2 measures now (Sales Amount and Target).


Next create dashboard add the report. Right click the dashboard and select 'Deploy to SharePoint...'. 

Wait for the SharePoint page to load and you can see the report.
 
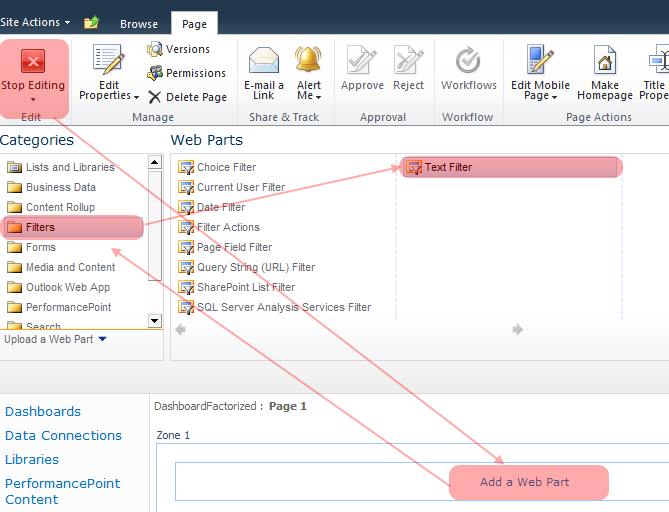
Time to add an input field where use can enter a value to be used by our report. So select 'Edit Page' from top. Click on 'Add Web Part' on which ever zone you would like the input box to appear. This would open the web part gallery. From 'Categories' select 'Filters' and from there select 'Text Filter'. Press 'Add' button.

 
Rename web part to your liking.

From web part setting select 'Connections' >> 'Send Filter Values To' >> 'Factorize Me' (this is the name of our analytical report). On the configure connection dialog box just check if the correct parameter is selected and press 'Finish'.


That is it, we are done. Enter a value and see the Target value change. (if the values does not change try edit/save SharePoint page again)
Cool feature to SharePoint 2010 to be able to connect web parts to PerformancePoint content.

One downside to this is that when we use custom MDX in reports the inherent analytic features are disabled like drill downs, pivot, (the new very useful) adding measure on the go etc.
External Links:
MDX in Dashboards, Scorecards, and Views?

Wednesday, May 12, 2010

SharePoint 2010 location of log files

If anyone is wondering what is the location of SharePoint 2010 log files. Copy the line below and paste it in run:
%programfiles%\Common Files\Microsoft Shared\Web Server Extensions\14\LOGS

SharePoint 2007 had '12' folder and SharePoint 2010 has '14'... hmm where did '13' go??? Superstitious I presume since most building don't have 13th floors :D