Friday, December 2, 2011

Installing SQL Server 2012 RC0 on Windows 7


SQL Server 2012 RC0, formerly known as “Denali”, is available to download. Got my copy and started installing on a copy on Windows 7 virtual box. The installation was smooth. 

Here are the steps:

After extracting the download file, double click the setup.exe. Select the first option under installation to install a stand alone version.Some checks, no issues.
Choose what type of edition you want to get.Some more checks.
Standard feature installation.Select the components.
Wondering where is BIDS; it’s been named to SQL Server Data Tools.Setup the instance id.
Configure roles to be used.Analysis services configurations.
Reporting Services settings.

Hit ‘Next’, rest of the steps are linear and at the end you have a successful SQL Server 2012.

Thursday, December 1, 2011

AdventureWorks and SQL Server 2012 RC0 and Access Denied

While attaching AdventureWorksDWDenali_Data.mdf to SQL Server 2012 RC0 if you get this error:
Unable to open the physical file "C:\Data\AdventureWorksDWDenali_Data.mdf". Operating system error 5: "5(Access is denied.)".

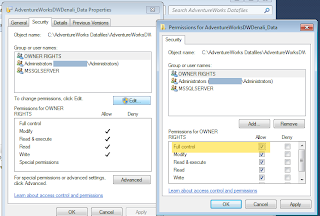
To fix Right Click --> Properties --> Security


Give Full Control access to the account you would be using.


Attach to database again.

Monday, November 21, 2011

Find out SQL Server Edition

Here is a query to find out what version and edition of SQL Sever you are using:

SELECT SERVERPROPERTY('edition') as Edition,
SERVERPROPERTY('productversion') ProdVersion,
SERVERPROPERTY('productlevel') as Lvl

Monday, August 29, 2011

Clear Analysis Services Cache

To test execution time of calculated measures from cold cache instead of warm cache run this query on Analysis Services MDX query editor:


<Batch xmlns="http://schemas.microsoft.com/analysisservices/2003/engine">
 <ClearCache>
<Object>
  <DatabaseID>NameOfCube</DatabaseID>  
</Object>
 </ClearCache>
</Batch>

Analysis Services Default Member Through Stored Procedure

Today, I had to dynamically assign default member value to an analysis services dimension. Scenario: Each user (AD login) has a preferred or default value assigned on time basis. So depending on which date data is sliced it always comes up with the value default of the current user.
For this we would need to create a mapping table in Relational database with date, user and default value.
Create a basic User Stored Procedure (uspGetUserDefaultValue) which takes username (AD Login) as a parameter, selects on the mapping table based on username passed and returns a single value.
Now we create a solution in Visual Studio 2008. This can be of class project template. We would be creating a custom DLL and register with SQL Server Analysis Services solution. Where SSAS solution would use function calls exposed by custom DLL. I created the project as part of my SSAS solution for better manageability.
We would need to add:
Microsoft.AnalysisServices
Microsoft.AnalysisServices.AdomdClient
as reference to our custom dll project. These can be of version 10 (SQL 2008) or version 9 (SQL 2005). Works fine with either, seamlessly interchangeable.
Now we create/rename our namespace and class to like
Project/Assembly: AnalysisServicesCustomLibrary
Namespace: CustomMethodCollection
Class: CustomMethods
or whatever you like.
Create a public static function like:
public static string GetUserDefaultValue(string userName)
{
OleDbConnection connection;
        try
        {
         connectionString ="provider=sqloledb;server=;database=;trusted_connection=yes";
           connection= new OleDbConnection(connectionString);
           connection.Open();
           OleDbCommand command= new OleDbCommand("uspGetUserDefaultValue", connection);
               command.CommandTimeout = 0;
               command.CommandType = CommandType.StoredProcedure;
               command.Parameters.Add(new OleDbParameter("@UserLogin", OleDbType.VarChar, 50));
               command.Parameters[0].Value = userName;
               
               DataTable dataTable = new DataTable("DefaultValue");
               OleDbDataAdapter dataAdapter= new OleDbDataAdapter(command);
               dataAdapter.Fill(dataTable);
               connection.Close();
               if (dataTable.Rows.Count == 0)
                   return "empty";
               string defaultValue = dataTable.Rows[0][0].ToString();
               return "[Dimension].[Dimension Attribute].&[" + defaultValue + "]";
           }
           catch (Exception ex)
           {
               errorMessage = "Some error: " + ex.Source + " Message: " + ex.Message;
               throw new Exception(errorMessage, ex);
           }
       }
The return part is critical since here we would be formatting the return value into a MemberUniqueName for the associated dimension attribute. Else is basic stuff, feel free to add better exception handling etc.

Do a quick test to see if you are getting the desired output from Stored Procedure and Class Function.
Now we move to Analysis Services solution. First step is to add reference to AnalysisServicesCustomLibrary project under Assemblies folder.
Next move to the dimension where you would like to have a default value. Go to properties of the attribute that would have the default value. Under DefaultMember enter:
STRTOMEMBER( AnalysisServicesCustomLibrary.CustomMethodCollection.CustomMethods.GetUserDefaultValue(UserName))
Here UserName is an Analysis Services keyword to get current logged in user’s account.
STRTOMEMBER converts the string passed by custom library’s function in a member.
Build/Deploy/Process cube. Run a query or browse the cube and you should have the default value against logged in user.


DEBUG
To debug your code, move to your custom library project. Go to Debug-->Attach to Process and select Msmdsrv.exe process. Add a breakpoint and try querying the dimension using the function.
References:
Friday, January 28, 2011

From Date To Date in PerformancePoint Analytical Chart


Today, we add From Date and To Date parameters to Performance Point Server Dashboard Designer’s Analytical Reports. Many times this is a requirement to allow users to select a starting and ending date to view charts/reports. This gives dynamic behavior to time range as compared to using pre-defined date attributes like Month, Week etc.

Start with creating a Report and select Analytical Chart. Add your required Dimensions and Measures including Time dimension.

Once done, move to the Query tab of the report it should be something like below depending on what artifacts you drop :

For demo I am using Time dimension on Bottom Axis and Total Time Decimal on Series. You are free to move time to any other axis. No worries, same process would apply.
From the bottom of the page add parameter from the Parameters section. Name them what you like, for purpose I use FromDate and ToDate. Give default values, these can be any valid dates.

With every parameter you add you would find a value added to your query canvas like <> and <>. For now it does not matter where they are just add parameters.
Move to your query and where ever your time dimension is used replace that with:
HIERARCHIZE ( {<>:<>} )
Your final query would be like:

Save/Publish your report.
In your dashboard section add filters from Filters tab. I am using Time Intelligence Calendar filters but any type of filter can be used.

If you opt to use any other type of filter remember to set your values in Report query respectively.
Now we have our filters and report. We add them to the dashboard page like so:

Now we start linking filters and report. First link FromDate filter like so:

In source value select your data source, here TestFromTo is my data source. Next press Filter Link Formula and type in Day. This defines what level of a hierarchy we would be referencing. Remember to setup Time properties in your data source.
Similarly we link ToDate filter like:

All done. Save/Publish and Preview.

Here dates selected in 14th September, 2009 and the report displays data for that day. Now changing the ToDate to 18th September, 2009 would show:

And we have From Date and To Date filters working on an Analytical Report.
This is very intuitive way of showing data to end users. A lot of stakeholders ask for this feature especially for Trend Charts/Reports.
Downside to this implementation is that we lose the right click contextual features of analytics like drill downs, decomposition tree etc.