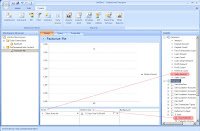
Questions: Can we pass a parameter value to an analytical report in our new SharePoint 2010's PerformancePoint Services environment? For example passing a numeric factor to report and calculate a new measure based on user input.
 Answer: Yes. I would assume that you have already a working environment of SharePoint 2010 along with PerformancePoint Services. We begin by opening the PerformancePoint Dashboard Designer.
Right click 'Data Connections' or from 'Create' ribbon select 'Data Source'. Configure to your already deployed cube.
 Right click on 'PerformancePoint Content' select 'New -> Report' or from 'Create' ribbon select 'Other Reports'. From the dialog box select 'Analytical Chart'. Press OK.
Name your report as desired I name it 'Factorize Me'.
For the sake of simplicity I would add one time dimension to the bottom axis and numeric value to series. This numeric values is upon which we are going to apply the factor. In my case it is 'Sales Amount'.
 I am using a Banking analysis services cube provided by Microsoft but this method can be used for any measure.
One more thing I would like to mention is regarding the use of sales amount as this tutorial would allow user to apply factor on sales for what ifs. Like what if I increase sales by 10% we can enter 1.1 and we have a projected sale of 10%. One can see a good utilization of this.
Back to the designing. Once we added the our dimensions we move to the 'Query' part of the report since we need to add a parameter.
Here is the query created by PerformancePoint Services:
SELECT
HIERARCHIZE( { [Tr Date].[YearToMonth].[Calendar Year].&[2009].&[Q 1].&[March], [Tr Date].[YearToMonth].[Calendar Year].&[2009].&[Q 2].&[April], [Tr Date].[YearToMonth].[Calendar Year].&[2009].&[Q 2].&[May] } )
ON COLUMNS,
{ [Measures].[Sales Amount]}
ON ROWS
FROM [Bank DW]
We would be editing it and adding a parameter. First add the required measure something like 'Target'.
WITH MEMBER [Measures].[Target] as ([Measures].[Sales Amount] * <> )
here <> is our parameter and would be automatically added to parameters section below. One thing to note is that I am using measure sales amount to make the change visible but we can use any other measure here.
Finally we use this new Target measure on ROWS along with sales amount measure. Here is the final query:
WITH MEMBER [Measures].[Target] as ([Measures].[Sales Amount] * <> )
SELECT
HIERARCHIZE( { [Tr Date].[YearToMonth].[Calendar Year].&[2009].&[Q 1].&[March], [Tr Date].[YearToMonth].[Calendar Year].&[2009].&[Q 2].&[April], [Tr Date].[YearToMonth].[Calendar Year].&[2009].&[Q 2].&[May] } )
ON COLUMNS,
{ [Measures].[Sales Amount], [Measures].[Target] }
ON ROWS
FROM [Bank DW]
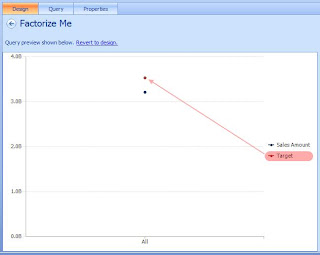
Assign a default value to our parameter <> and switch to design pane where you would be seeing 2 measures now (Sales Amount and Target).

Next create dashboard add the report. Right click the dashboard and select 'Deploy to SharePoint...'.
Wait for the SharePoint page to load and you can see the report.
Time to add an input field where use can enter a value to be used by our report. So select 'Edit Page' from top. Click on 'Add Web Part' on which ever zone you would like the input box to appear. This would open the web part gallery. From 'Categories' select 'Filters' and from there select 'Text Filter'. Press 'Add' button.
Rename web part to your liking.
From web part setting select 'Connections' >> 'Send Filter Values To' >> 'Factorize Me' (this is the name of our analytical report). On the configure connection dialog box just check if the correct parameter is selected and press 'Finish'.
That is it, we are done. Enter a value and see the Target value change. (if the values does not change try edit/save SharePoint page again)
Cool feature to SharePoint 2010 to be able to connect web parts to PerformancePoint content.
One downside to this is that when we use custom MDX in reports the inherent analytic features are disabled like drill downs, pivot, (the new very useful) adding measure on the go etc.
External Links:
MDX in Dashboards, Scorecards, and Views?
 Answer: Yes. I would assume that you have already a working environment of SharePoint 2010 along with PerformancePoint Services. We begin by opening the PerformancePoint Dashboard Designer.
Right click 'Data Connections' or from 'Create' ribbon select 'Data Source'. Configure to your already deployed cube.
 Right click on 'PerformancePoint Content' select 'New -> Report' or from 'Create' ribbon select 'Other Reports'. From the dialog box select 'Analytical Chart'. Press OK.
Name your report as desired I name it 'Factorize Me'.
For the sake of simplicity I would add one time dimension to the bottom axis and numeric value to series. This numeric values is upon which we are going to apply the factor. In my case it is 'Sales Amount'.
 I am using a Banking analysis services cube provided by Microsoft but this method can be used for any measure.
One more thing I would like to mention is regarding the use of sales amount as this tutorial would allow user to apply factor on sales for what ifs. Like what if I increase sales by 10% we can enter 1.1 and we have a projected sale of 10%. One can see a good utilization of this.
Back to the designing. Once we added the our dimensions we move to the 'Query' part of the report since we need to add a parameter.
Here is the query created by PerformancePoint Services:
SELECT
HIERARCHIZE( { [Tr Date].[YearToMonth].[Calendar Year].&[2009].&[Q 1].&[March], [Tr Date].[YearToMonth].[Calendar Year].&[2009].&[Q 2].&[April], [Tr Date].[YearToMonth].[Calendar Year].&[2009].&[Q 2].&[May] } )
ON COLUMNS,
{ [Measures].[Sales Amount]}
ON ROWS
FROM [Bank DW]
We would be editing it and adding a parameter. First add the required measure something like 'Target'.
WITH MEMBER [Measures].[Target] as ([Measures].[Sales Amount] * <
here <
Finally we use this new Target measure on ROWS along with sales amount measure. Here is the final query:
WITH MEMBER [Measures].[Target] as ([Measures].[Sales Amount] * <
SELECT
HIERARCHIZE( { [Tr Date].[YearToMonth].[Calendar Year].&[2009].&[Q 1].&[March], [Tr Date].[YearToMonth].[Calendar Year].&[2009].&[Q 2].&[April], [Tr Date].[YearToMonth].[Calendar Year].&[2009].&[Q 2].&[May] } )
ON COLUMNS,
{ [Measures].[Sales Amount], [Measures].[Target] }
ON ROWS
FROM [Bank DW]
Assign a default value to our parameter <

Next create dashboard add the report. Right click the dashboard and select 'Deploy to SharePoint...'.
MDX in Dashboards, Scorecards, and Views?


